Table of Isobars
Not the Segre Chart
Many people just do not get the gist of The Incremental Table of Atomic
Isobars. I present the idea that Hydrogen in its three forms that occur
naturally, two of which are stable, comprise more that 90%, by mass, of
the universe. This makes Hydrogen-1, the most common isotope, the most
abundant Isobar in the cosmos. The stability of Hydrogen with its single
proton is vastly orders of magnitude above the stability of any other
isobar. Hydrogen-2 is stable but not abundant. Hydrogen-3 is radioactive
(with a half-life of 12.33yrs.) and is less abundant more so.
Arranging the species of hydrogen in this fashion allows us to
observe how the number of nucleons relate to atomic stability much more
so than we would see in the chart at
this
link that
is provided by the US government. It is a very useful chart and you
should use it often. The Trilinear Chart of the Nuclides used hexagons
and is
no longer in print. A third chart called the
Segre Chart is very useful to chemistry but none of the three versions
lend to metaphor of a geometric basis to stability and durablity.
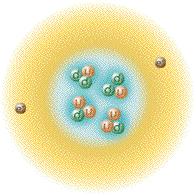
Helium is the second most abundant element
0.000137% of which is the Helium-3 flavor. Helium-4 while not as stable
as the single proton of Hydrogen-1 is still stable by orders of
magnitude above all other atomic nuclei. Consider the radioactive decay
of practically all heavy elements beyond Bismuth-209, in particular
Uranium-238 is by the means of emission of an alpha particle,
92U
238 —>
90
Th
234 +
2He
4, which is essentially a
Helium-4 nucleus.
Again by arranging the species of helium in a fashion corresponding
with the proton/neutron ratios with that thus far depicted allows us to
observe how the number of nucleons of each nuclide relate to atomic
stability. The chart laid out thusly can accommodate the addition of
useful information, also we can include entities like Hydrogen-4 which
can exist in the laboratory but do not hang around for very long.
H 001
99.985%
SUPER
Stable
1.0078250 |
| |
H 002
0.015%
Stable
2.0141017 |
He 003
0.000137%
Stable
3.0160293
|
|
H 003
12.33 yr
B-
He-3
3.0160492
|
| |
He 004
99.999863%
SUPER
Stable
4.0026032
|
|
H 004
5.42 MeV
n,2.980 MeV
H-3
4.0279121
|
Entities in a column all share the same proton/neutron ratio while those
in the same row are Isobars.
(nuclides of roughly the same atomic
weight but different elements)
(having the same number of nucleons)
see Binding EnergyThe blocks holding H-1 and He-4 are marked off
with yellow to denote these "nuclides" as SUPER Stable.
Please if you would care to guess what the Third most abundent Element in the universe is?
Let's put that a different way, Where on this chart would you expect to see the next most abundent Element placed?
| n=p-1 |
n=p |
n=p+1 |
n=p+2 |
n=p+3 |
n=p+4 |
| H 1 |
|
|
|
|
|
| |
H 2 |
|
|
|
|
| He 3 |
|
H 3 |
|
|
|
| |
He 4 |
|
|
|
|
| |
|
|
|
|
|
| |
|
|
|
|
|
| |
|
|
|
|
|
| |
|
|
|
|
|
| |
|
|
|
|
|
| |
|
|
|
|
|
| |
|
|
|
|
|
| |
C 12 |
|
|
|
|
| |
|
|
|
|
|
| |
N 14 |
|
|
|
|
| |
|
|
|
|
|
| |
O 16 |
|
|
|
|
| |
|
|
|
|
|
| |
|
|
|
|
|
| |
|
|
|
|
|
| |
Ne 20 |
|
|
|
|
